
Key Observations
- After a brisk rally in October, most asset classes saw muted returns in November.
- Policy participants have expressed sharply divergent views on future interest rate decisions, leaving investors cautiously optimistic.
- Persistent concentration and high valuations raise the possibility of fragility in markets and warrant thoughtful portfolio construction as we look to 2026.
Market Recap
November’s market action was defined by turbulence. The S&P 500 fell over 3.0% during the first three weeks of the month on fears of an AI Bubble and uncertainty over expectations for future interest rate cuts. Fears eventually subsided, and, as we saw, the Fed cut the Federal Funds rate by 25 basis points – something widely expected in the days leading up to the meeting. As the month drew to a close in a shortened trading day after Thanksgiving, the S&P 500 posted a monthly return of 0.2%. Small caps, represented by the Russell 2000, outperformed with a 1.0% advance, hinting at a tentative rotation away from mega-cap dominance.
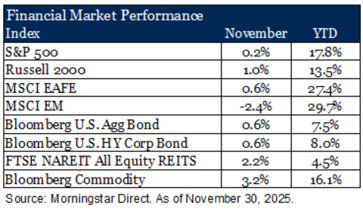
International developed equities, as measured by the MSCI EAFE Index, rose 0.6%, supported by a softer dollar and improving sentiment in Europe and Japan. In contrast, emerging markets declined 2.4%, as China’s recovery stalled and geopolitical risks weighed on sentiment. China is a country that we have been weary of for a while now.
Fixed income saw modest gains, as both the Bloomberg U.S. Aggregate and High Yield Indexes advanced 0.6% amid falling rates and resilient credit fundamentals. Last week, attention turned to the Fed’s December meeting where, as expected, they cut rates by 25 basis points while signaling that they are close to the neutral rate. Chairman Powell did not provide a lot of guidance moving forward due to the large amount of economic data set to be released in the coming weeks that was delayed due to the government shutdown. While a new chair will be appointed in the spring, the path forward largely hinges on how the economy holds up with the hope that inflation continues to come down while not seeing a meaningful spike in unemployment.
A Pause for Perspective
Markets navigated a turbulent November as headlines shifted from government shutdown risks to delayed economic releases and renewed debate over AI valuations. While price action captured attention, it only tells part of the story. The market’s recent behavior invites a deeper look at what is driving returns beneath the surface.
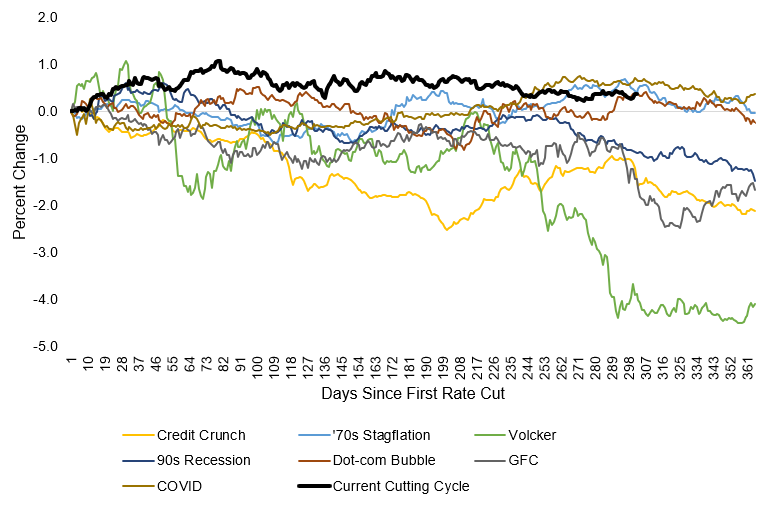
We have now had 175 basis points of rate cuts since the first cut in 2024. The bond market has exhibited a unique response to Fed action, with the long end of the curve persistently rising. In fact, the only significant historical period with similar market action was during stagflation in the 1970s. Today, the bond market is seemingly pricing in similar concerns on inflation. This raises the question: what happens when the Fed stops cutting rates? For investors, active management in fixed income may help navigate what could be a non-linear rate environment.
Cumulative Change in UST 10-Year Yield
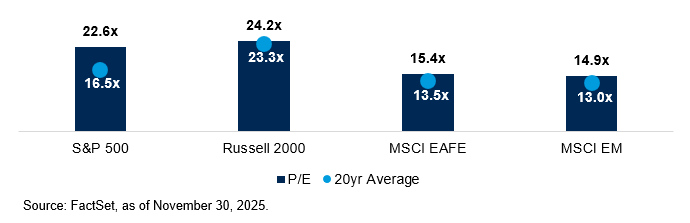
Valuations remain elevated across major indices. The S&P 500’s year-to-date gain in the high teens leaves earnings multiples above historical averages. Positive earnings growth provides some justification, but the margin for error narrows. For long-term investors, being mindful of current valuations and thoughtfully allocating portfolios may help attain investment goals.
Current Valuations
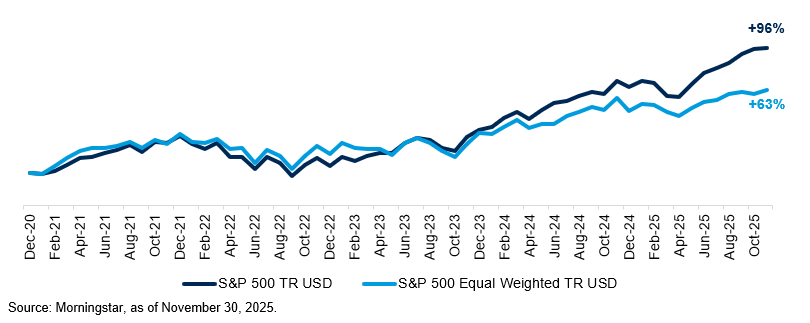
Market concentration remains a defining feature and creates structural risk in portfolios that are not diversified. Today, the top ten stocks in the S&P 500 make up 40% of the total market capitalization, driven predominately by enthusiasm in AI related constituents [1]. Astonishingly, NVIDIA’s market cap has grown to nearly twice the size of the entire Russell 2000 [1]. Market leadership has created significant performance dispersion amongst index constituents. This has become more profound since the beginning of 2024. Concentration amplifies both risk and opportunity. Understanding how portfolios are positioned and the underlying exposures will help investors weigh potential market scenarios and the impact they may have on investment outcomes.
Indexed Cumulative Performance
Outlook
As the year winds down, markets remain supported by moderating inflation, stable monetary policy and a favorable corporate fundamental backdrop. However, elevated valuations, concentration driven by the strength in AI related securities, and persistent macro uncertainty call for thoughtful diversification and disciplined risk management. Our upcoming 2026 Investment Outlook will explore some of these themes in greater depth, and provide guidance for the positioning of portfolios in an evolving market environment.
Sources
[1] Morningstar Direct, as of November 30, 2025.
Disclosures
The information provided is illustrative and for educational and informational purposes only and does not constitute investment advice and it should not be relied on as such. It should not be considered a solicitation to buy or an offer to sell a security. It does not take into account any investor's particular investment objectives, strategies, tax status or investment horizon. You should consult your attorney or tax advisor.
The views expressed in this commentary are subject to change based on market and other conditions. This document may contain certain statements that may be deemed forward looking statements. Please note that any such statements are not guarantees of any future performance and actual results or developments may differ materially from those projected. Any projections, market outlooks, or estimates are based upon certain assumptions and should not be construed as indicative of actual events that will occur. Certain targets within the presentation are estimates based on certain assumptions and analysis made by the advisor. There is no guarantee that the estimates will be achieved.
All information has been obtained from sources believed to be reliable, but its accuracy is not guaranteed. There is no representation or warranty as to the current accuracy, reliability or completeness of, nor liability for, decisions based on such information and it should not be relied on as such.
No investment strategy or risk management technique can guarantee returns or eliminate risk in any market environment. All investments include a risk of loss that clients should be prepared to bear. The principal risks of Clarendon Private’s strategies are disclosed in the publicly available Form ADV Part 2A.
Diversification does not ensure a profit or guarantee against loss. Asset Allocation may be used in an effort to manage risk and enhance returns. It does not, however, guarantee a profit or protect against loss. Index returns are unmanaged and do not reflect the deduction of any fees or expenses.
Comparisons to any indices referenced herein are for illustrative purposes only and are not meant to imply that actual returns or volatility will be similar to the indices. Index returns reflect all items of income, gain and loss and the reinvestment of dividends and other income. You cannot invest directly in an Index.
S&P 500 is a capitalization-weighted index designed to measure performance of the broad domestic economy through changes in the aggregate market value of 500 stocks representing all major industries.
Russell 2000 consists of the 2,000 smallest U.S. companies in the Russell 3000 index.
MSCI EAFE is an equity index which captures large and mid-cap representation across Developed Markets countries around the world, excluding the U.S. and Canada. The index covers approximately 85% of the free float-adjusted market capitalization in each country.
MSCI Emerging Markets captures large and mid-cap representation across Emerging Markets countries. The index covers approximately 85% of the free-float adjusted market capitalization in each country.
Bloomberg U.S. Aggregate Index covers the U.S. investment grade fixed rate bond market, with index components for government and corporate securities, mortgage pass-through securities, and asset-backed securities.
Bloomberg U.S. Corporate High Yield Index covers the universe of fixed rate, non-investment grade debt. Eurobonds and debt issues from countries designated as emerging markets (sovereign rating of Baa1/BBB+/BBB+ and below using the middle of Moody’s, S&P, and Fitch) are excluded, but Canadian and global bonds (SEC registered) of issuers in non-EMG countries are included.
FTSE NAREIT Equity REITs Index contains all Equity REITs not designed as Timber REITs or Infrastructure REITs.
Bloomberg Commodity Index is calculated on an excess return basis and reflects commodity futures price movements. The index rebalances annually weighted 2/3 by trading volume and 1/3 by world production and weight-caps are applied at the commodity, sector and group level for diversification.
Clarendon Private, LLC (“Clarendon Private”) is a registered investment advisor. Advisory services are only offered to clients or prospective clients where Clarendon Private and its representatives are properly licensed or exempt from licensure. For additional information, please visit our website at https://www.clarendonprivate.com/ or the Investment Adviser Public Disclosure website at www.adviserinfo.sec.gov by searching with Clarendon’s CRD # 316616